How Central and Eastern Europe can overhaul its dated growth narrative

The pandemic has exposed the weaknesses of export-led manufacturing economies. Soňa Muzikárová (GLOBSEC), Daniel Dujava (Institute for Financial Policy), José Emilio Gumiel (European Central Bank) and Branislav Žúdel (Institute for Financial Policy) introduce a tool to help Central and Eastern European countries devise a new growth paradigm.
Even before the pandemic, Central and Eastern Europe’s reliance on manufacturing exports was looking risky. COVID-19 further emphasised the weaknesses of the CEE’s macroeconomic model: its vulnerability to external disruption, the exposure of global value chains to shocks, and the impact of lockdowns on businesses that lack a digital infrastructure.
The European Commission’s rescue plan highlights the need to rewire Europe’s economies in a greener and smarter way. The pandemic offers a unique historical opportunity – perhaps only comparable to the early transition years – for the region to position itself strategically for continued economic success. Countries can assess their resilience, identify areas where progress is most pressing and prioritise them as a part of the rebuilding efforts. This is the purpose of the Strategic Transformation Index (STI) tool.
The composite index tracks relative performance focusing on CEE9 countries – Austria, Bulgaria, Croatia, Czechia, Hungary, Poland, Romania, the Slovak Republic, and Slovenia – set against the performance of a richer club of western countries: Germany, Sweden, Denmark, Finland, Estonia, the Netherlands, Belgium and France (hereafter referred to as the ‘control group’). STI covers eight structural areas, including macroeconomic fundamentals, resilience, and the capacity to innovate, tailored to the region’s common transitional past. They also take in structural features where progress needs to be made, with the aim of the regional economy continuing a path of real economic convergence and ultimately graduating to a high-income bracket. Importantly, the STI framework emphasises economic resilience in the context of COVID-19 and the massive disruptions it brought. The composite index can be split into a macroeconomic and resilience pillar and an innovation pillar, each comprising four structural areas:
Pillar 1: Macro-economy and resilience
• Openness captures qualities such as forward participation global value chains, degree of export market penetration, and degree of openness to foreign investment
• External vulnerability reflects economic complexity, both, in terms of production portfolio and exports, as well as terms of trade. Export complexity is assessed by both the diversity of products and the diversity of recipient markets
• Productivity and value-added describes the effectiveness of productive capacity aggregate measures (such as Total Factor Productivity), but also more targeted ones (such as the share of high- and medium-tech of value-added in manufacturing, or in total exports or employment in knowledge-intense activities)
• Financial structure relies on the premise that a sound financial footing buttresses economic resilience. The STI framework includes targeted measures of household indebtedness, housing market imbalances, and tracks bank non-performing loans or long-term interest rate levels
Pillar 2: Innovation economy
• Education comprehensively captures education quality, quantity, access, and outcomes, and as such constitutes a basic pillar of any economy striving for innovation-led growth
• Greening economy including a broad range of measures, such as CO2 production, air quality, recycling rate, or shares of renewable energy consumption
• Digital economy – including internet access and use, e-commerce and e-government – which has also gained urgency in European recovery and resilience planning
• Ability to innovate – understood in a complex way, as both the conditions for innovation and innovation outcomes. This is a necessary element for moving up to a high-income bracket.
The 2020 edition of the STI refers to pre-COVID-19 information (with annual data from 2018). Relating it to the 2018 development level offers interesting insights. Unsurprisingly, countries with higher per capita GDP tend to perform better in terms of the headline STI (Figure 1, left-hand-side), while the correlation is even stronger for CEE9 (Figure 1, right-hand-side). The latter is in line with the tailored quality of STI to the region.
Figure 1 Strategic Transformation Index by country and development level
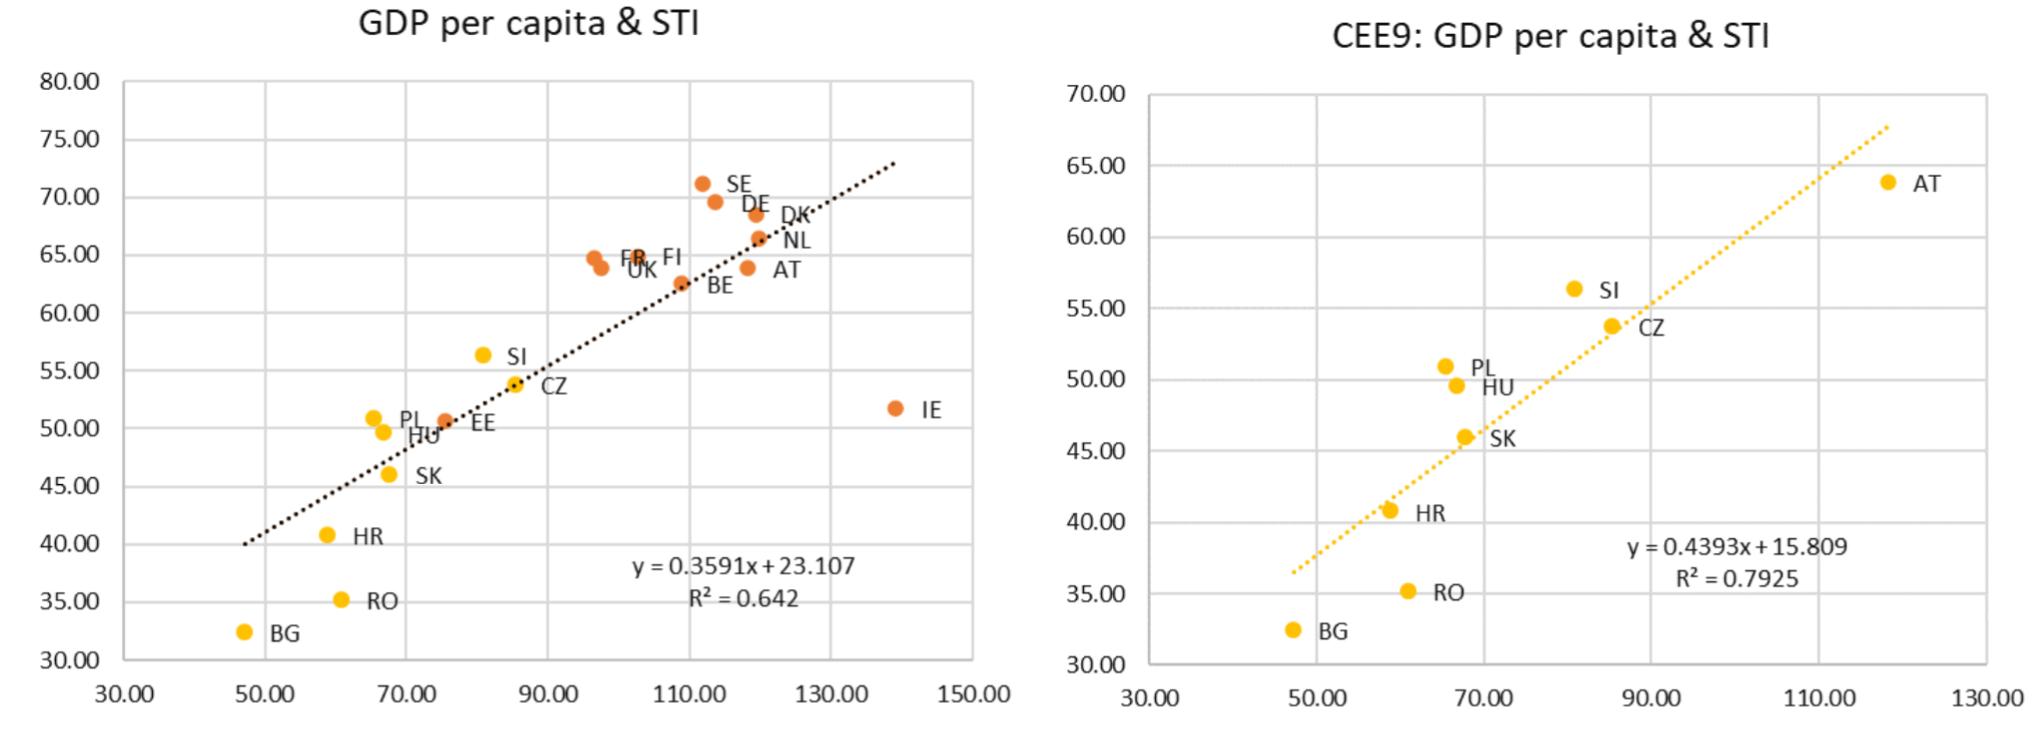
Notes: GDP at current prices per capita relative to EU-15 in PPS and Strategic Transformation Index (STI) Overall Rank (2020). Source: Authors’ calculation, EC Ameco. In all figures, for Ireland, GNI at current prices per capita relative to EU-15 in PPS is used instead of GDP, due to distortion related to the heavy presence of multinational enterprises.
Splitting the headline STI into its two pillars, (1) macroeconomy and resilience and (2) innovation economy (Figure 2), the second pillar shows a stronger positive correlation with per capita GDP on the full sample. This is in line with expectations, as STI Pillar 2 contains a more structural, and geographically universal set of variables – such as education, digital and green economy, and the capacity to innovate – conducive to moving up on the income ladder, while Pillar 1 is more tailored to the CEE9 specificities and transitional growth narrative.
Figure 2 STI by pillar, country and development level
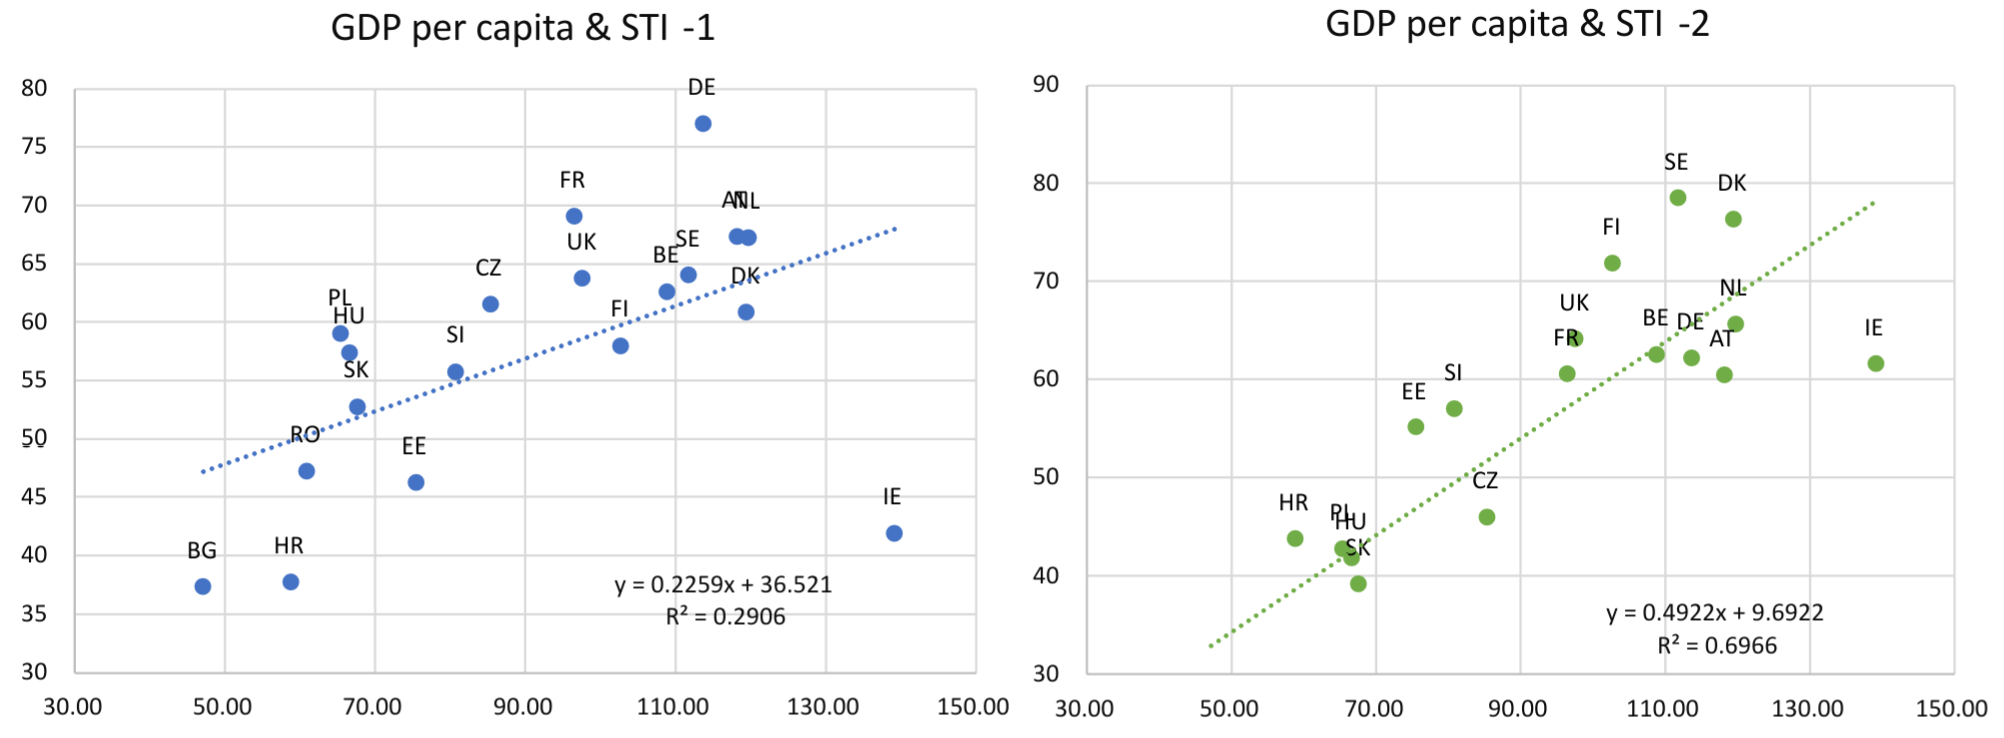
Notes: GDP per capita relative to EU-15 in PPS and Strategic Transformation Index Pillar 1 (Macroeconomy & Resilience) and Pillar 2 (Innovation economy) Rank (2020).
Source: Authors’ calculation, EC Ameco, GLOBSEC.
A more granular assessment – zooming in on the eight structural sub-indices individually – suggests that the strongest correlation with the level of development is observed when it comes to the capacity to innovate and digital economy in terms of Pillar 2 (Figure 3). This chimes with the idea that wealthier countries’ economic performance is supported by robust innovation fundamentals and advanced digital infrastructures.
Figure 3 STI by sub-index, country and development level
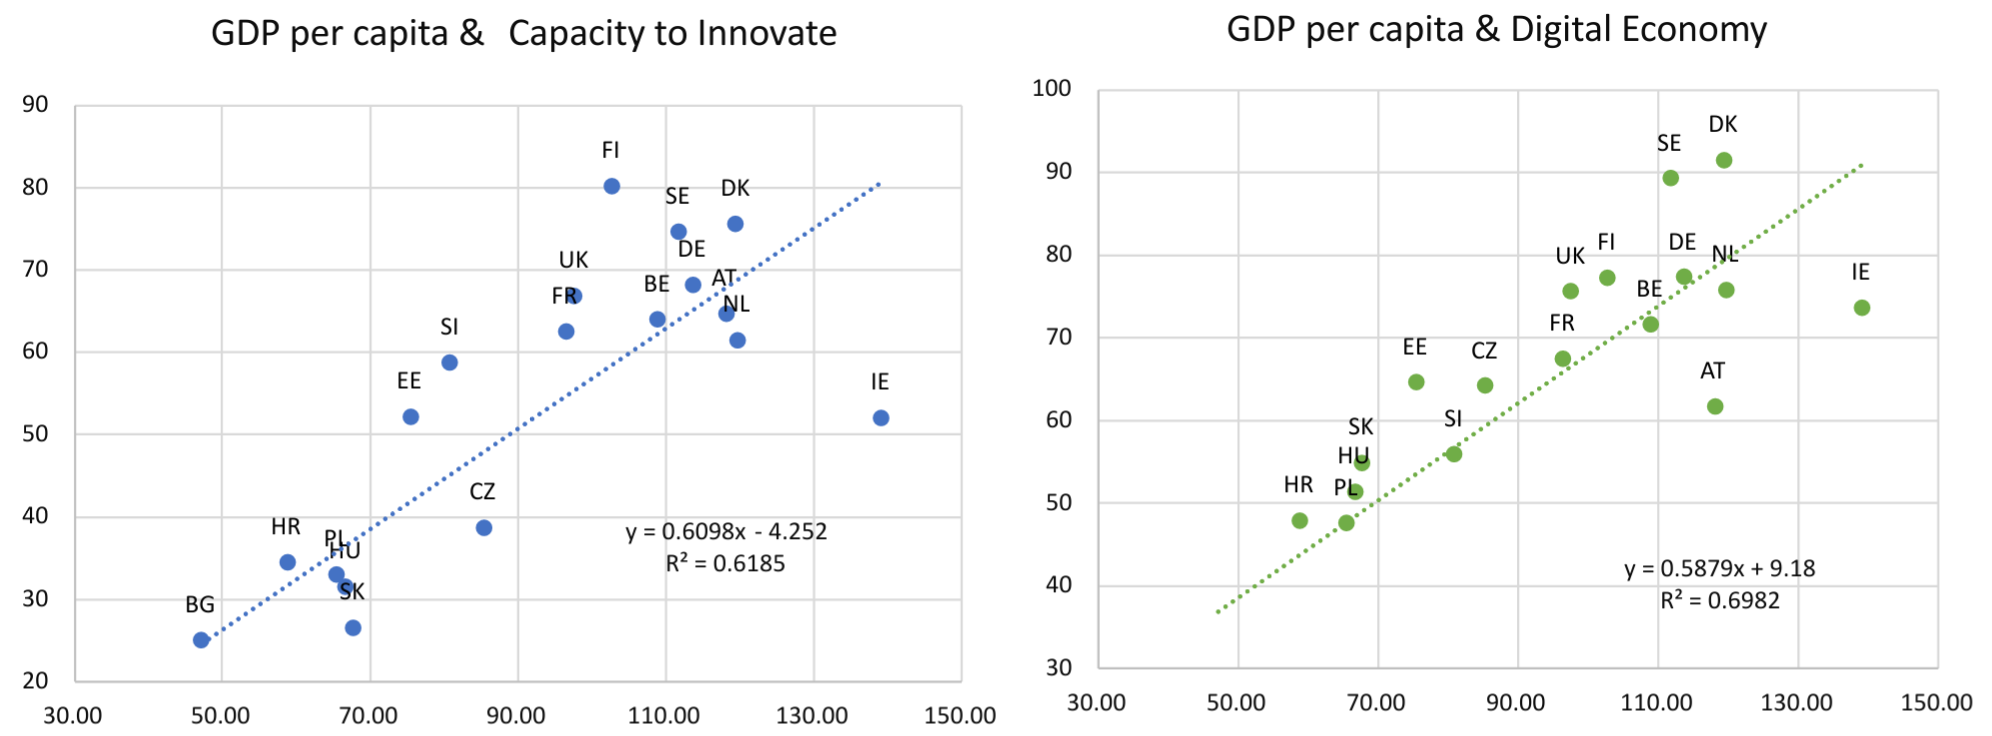
Notes: GDP per capita relative to EU-15 in PPS and Strategic Transformation Index Capacity to Innovate (Pillar 2) and Digital Economy (Pillar 2) Rank (2020).
Source: Authors’ calculation, EC Ameco, GLOBSEC.
COVID-19 accentuates the underlying weakness in CEE’s prevalent economic growth model. The CEE9’s economic performance is historically based on relatively low labour costs, foreign direct investment (FDI) and export gains related to global value chains (GVCs). Yet based on the information available to date, none of those drivers has been helpful in terms of mitigating the impact of the pandemic, and some of them even exacerbated its adverse effects. While current CEE9 growth engines may support the cyclical recovery, they could pose graver challenges after the pandemic.
Moreover, COVID-19 intensifies the need for CEE9 countries to upgrade their existing growth paradigms towards more digital, knowledge-based and innovative growth. The latter is corroborated by a positive relationship between STI Pillar 2 and 2021 GDP gap based on IMF forecasts, which measures the economic impact of the pandemic and anticipated recovery (Figure 4, left-hand side). The CEE9 countries with a higher score in STI Pillar 2 tend to mitigate losses from the COVID-19 shock.
Figure 4: STI Pillar 2 by country and speed of recovery (LHS); difference in the average performance of CEE9 versus control group by STI Pillar (RHS)
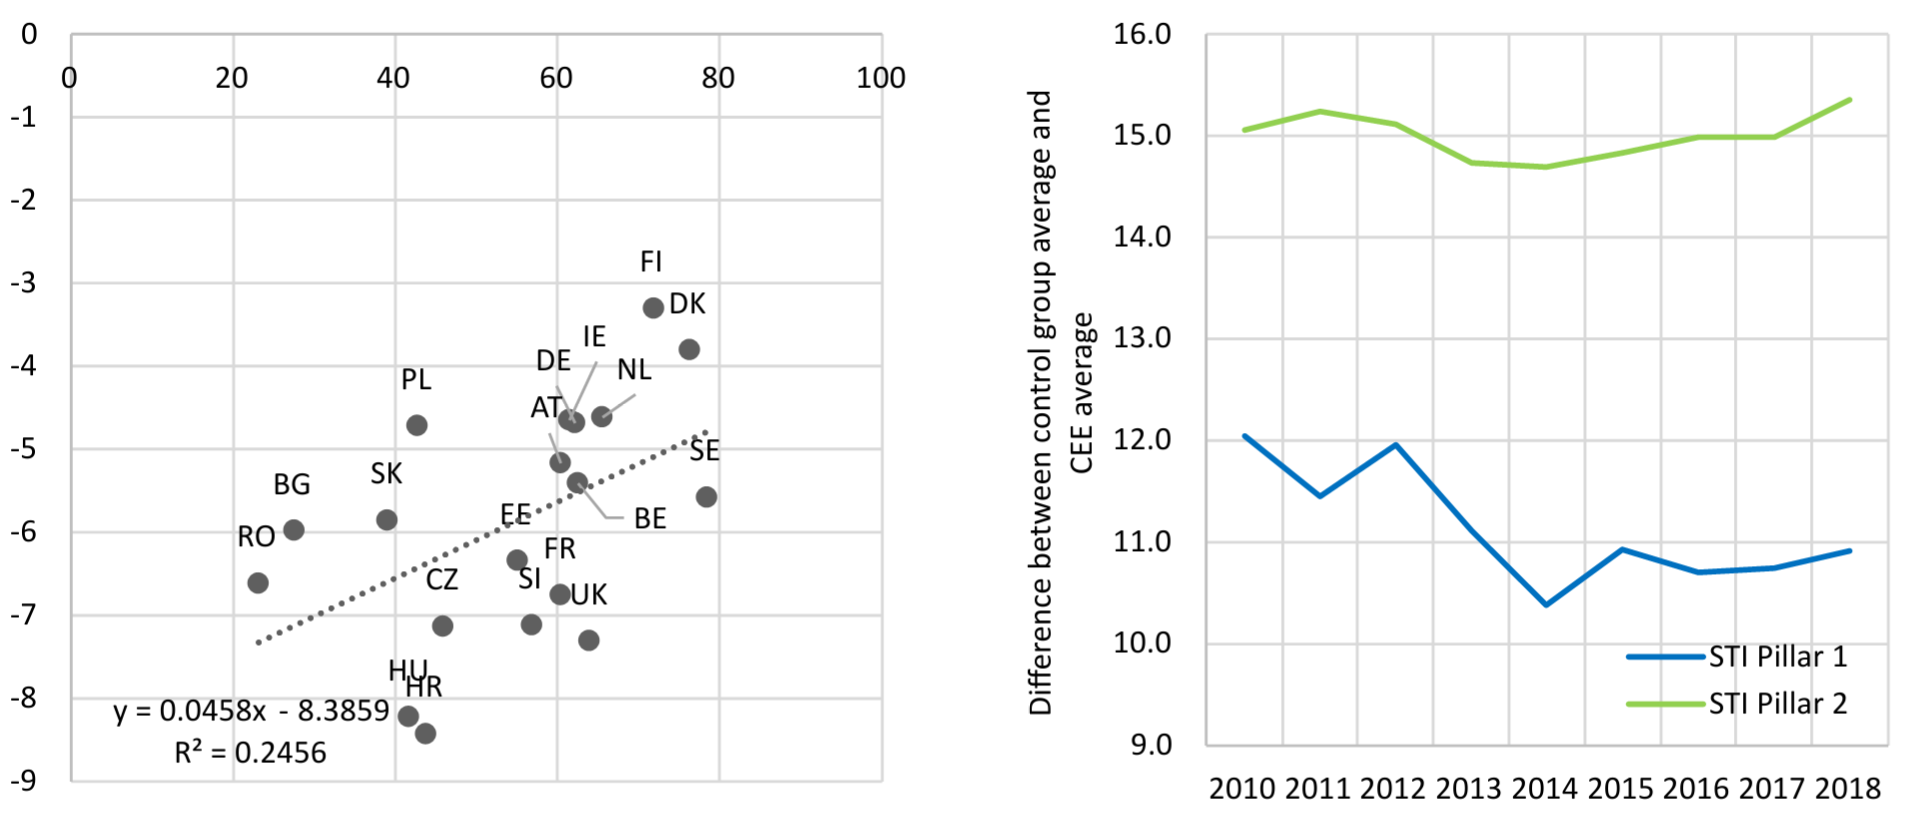
Notes: Forecast gaps are calculated from IMF World Economic Outlook Autumn 2019 and Autumn 2020 editions.
Source: Authors’ calculation, IMF, GLOBSEC.
Stronger rankings in the STI Pillar 2 increase the strength of the recovery (Figure 4, right-hand-side). The 2021 pre-and-post pandemic IMF forecasting editions (i.e. GDP gap) as an indicator of economic recovery and STI Pillar 2 yield a fairly strong correlation, driven mainly by education, the digital economy and capacity to innovate sub-components. Conversely, economic recovery lags in countries that underperform in these areas.
In conclusion, qualitative change in the economic growth paradigm – with an emphasis on innovative, smart and sustainable growth – is a prerequisite for continuing to close the gap between CEE9 and the control group of more advanced countries.
This article was originally published on the LSE website on 22 January 2021

Head of Macroeconomic Analyses and Forecasts at the Ministry of Finance in the Slovak Republic (Institute for Financial Policy)
Senior Economist at the Ministry of Finance in the Slovak Republic
Principal Economist at the European Central Bank